
In the world of digital marketing, analytics is king. It’s the one marketing discipline where everything from impression down to conversion can be tracked and measured over time. With the ability to use Google Analytics, you can make educated business decisions such as:
- Where to spend your marketing budget
- Whether your website is converting
- Where your audience is located
- What type of content resonates best with your target audience
Google Analytics
For a practice to be able to track its website activity and digital marketing acquisition traffic, we would recommend installing Google Analytics on your website.
Google Analytics is a free web analytics service offered by Google that allows you to track a multitude of stats such as:
- Volume of Visitors (Sessions)
- Pageviews
- Traffic Acquisition
After visiting https://analytics.google.com/ and signing up for an account, all you then need to do is apply the tracking pixel to all pages of your website and you are up and running.
Key Google Analytics Metrics
When utilising Google Analytics, you’ll come across a large number of metrics, some of which you might not be familiar with. To get you started, here are the main metrics and their definitions:
Sessions – A session is a more comprehensive way of looking at a visit to your site. It groups together all the interactions that take place on your website within a given timeframe. For example a single session can contain multiple pageviews, events, social interactions, and ecommerce transactions.
A session expires after 30 minutes of visitor inactivity, at midnight or if a user revisits the website via another traffic source (paid search, social media etc).
Users – Users are essentially unique visitors that have had at least one session within the selected date range. Includes both new and returning users.
Pageviews – Pageviews is the total number of pages viewed, including repeated views of a single page. A pageview is counted when a page on your site is loaded by a user’s browser. If a user reloads the page, this is then counted as an additional pageview. If the user travels to a different page and then back to the original page, this is also seen as an additional pageview.
Pages/session – The average number of pages a user viewed during a session on your site. Generally speaking, the more pages, the better, as this suggests that users are more engaged with your site as a whole.
Percentage of New sessions – An average percentage of first-time visitors on your site. This can be a good metric to track if you drastically change the layout or content of your site.
Bounce rate – Is the percentage of single-page sessions. These are sessions in which the user visits a page, and then leaves your site from the same page. They do not interact with any other pages on your site – they essentially see one page and then ‘bounce’ off.
New vs Returning Visitors – New visitors are those users that have not visited your site before the time period specified, while returning visitors will have made at least one visit to at least one page on your site previously. This is again determined by whether Google Analytics can detect cookies, which indicate previous visits. Whenever you visit a website, it drops a ‘cookie’ or snippet of data on your computer’s web browser. If someone clears their browsing history/cookies, or uses a different browser such as Safari or Chrome, Google Analytics will classify them as a new user as they won’t be able to associate them with past visits. If Google cannot detect a cookie one will be set for future analytics tracking, unless the user has disabled cookies in their personal browser preferences.
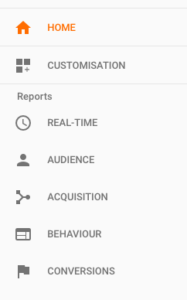
Navigating Google Analytics
When logging into Google Analytics, you’ll notice it is split between 5 key report types:
- Real-Time
- Audience
- Acquisition
- Behaviour
- Conversions
Real-Time Reports
Google Analytics Real Time reports allow you to observe live user data including sessions, pageviews and more.
Real time reports are handy when launching a particular campaign or for testing conversions in a live format.
Audience
Audience Reports show you characteristics of your website users.
Audience Reports allow you to get to know your users – where they are, how often and how long they engage with your content, and what devices are most popular. The Audience reports give you a sense of the users that engage with your website content.
- Active Users
- Demographics (Age & Gender)
- Interests (Affinity Categories)
- Geographic Location
- Technology
- Mobile
- Devices
- User Flow
- Cohort Analysis
Acquisition
Acquisition reports allow you to discover which channels are bringing traffic to your website.
You can also use these reports to learn more about your traffic (for example if they arrive directly on your site or via a search engine or social media) and how successful certain marketing campaigns are in attracting users. The acquisition section of Google Analytics includes reports like:
- All Traffic > Channels – this is a useful report that shows you which channels are driving the most traffic to your site, whether it be Paid or Organic search, Social Media, Email campaigns or Display (online advertising) campaigns. Or people may be typing your website straight into their browser, which is classified as Direct
- All Traffic > Source/Medium – a more detailed version of Channels, for example it breaks Social down into Facebook, Twitter, LinkedIn
- Referrals – shows which other websites are referring traffic to your site
- Social – this section provides more detail on social media referral traffic performance
- Campaigns > All Campaigns – we recently covered how to set up UTM tracking of website URLs for any online campaigns you may run for your practice. Here is where you will be able to track the results. The first column will show the name of the campaign, which you created using the URL building tool. You can then see how many user sessions it drove to your site.
Need Help Marketing Your Practice?
Book a FREE consult with a HealthEngine expert to learn how to grow faster, work smarter and engage better.
Get a free demoBehaviour
Behaviour reports show you how users engaged with your website such as which pages they landed or exited from.
You can use these reports to understand the number of pages seen per session, how long a typical session lasts etc. Popular metrics in this section include:
- Site Content > All Pages – this is where you see number visits to each page of your website. If you want to see stats for a particular page, you can type it in the filter box
- Behaviour Flow – how users progress through your site
- Site Speed – shows your average page load times, which as we covered previously need to be optimised to maintain user interest
Conversions
The last major section of Google Analytics is Conversions. These reports allow you to see metrics for conversions you have set up. The main metrics included in this area are:
- Goals > Overview – useful if you set up any conversion goals on your website, for example if people watched a video or clicked on a particular button
- Ecommerce Reports – only relevant for retail based sites, rather than professional services websites such as small business healthcare providers
- Multi Channel Funnel Reports and Attribution Reports – these are more complex aspects of digital marketing, that look at how people interact with all your different online advertising touchpoints before landing on your site and converting. Again, not highly relevant for small businesses with limited advertising spend.
In Summary
Google Analytics is a free, powerful and insightful tool for tracking not only the performance of your website, but of your online advertising as well. Whilst the menu system can seem overwhelming initially, once you jump in and start navigating the options you’ll find it a very user friendly tool. Google also has a wealth of online support articles for any aspects of Analytics you want to learn about in more depth. Happy exploring!